Results
Subscription app results, straight from the revenue dashboard
Four subscription apps with very different starting points. In the three revenue charts, growth bends upward after month 0, the month we took over their Meta ads and creative. The fourth shows what happened inside an ad account as we scaled it. The apps stay anonymous, but every number comes from their unedited RevenueCat or Meta dashboards, and the original screenshot is one click away.
Every line bends at month 0
Before we startedAfterEach row has its own scale.
What happens at month 0
The same three steps for every app
Each app went through the same process. It changes who the ads speak to and what they say in the first few seconds.
Step 1
Find new personas
We go through app reviews, onboarding answers and competitor ads to find every group of people who pays for the app and what each one is trying to fix. Then we look for the groups the current ads aren't speaking to.
Step 2
Map their market awareness
Some people don't know their problem has a fix. Some are comparing apps. Some already know the brand. We place each persona on the five levels of market awareness, because each level needs the ad to do a different job.
- Unaware
- Problem aware
- Solution aware
- Product aware
- Most aware
Step 3
Build creative that opens on the pain point
Each ad is written for one persona at one awareness level, and opens on their pain point in the words they use for it. We test in batches, cut losers fast and scale the angles that move trials and revenue.
Client A · Subscription app · ARR, daily
ARR up 4.7× in seven months
- ARR when we started, Apr 2026
- $8.0k
- ARR on 24 Oct 2026
- $38.0k
- ARR added per month
- $1.3k → $4.4kbefore → after
In plain numbers
Client A's ARR grew from $8.0k at the start of April 2026 to $38.0k on 24 October 2026, 4.7 times in about seven months. Before we started it was adding about $1.3k of ARR a month. Since then it has added about $4.4k a month.
What we did: found new personas, mapped each one to its level of market awareness, and built creative that opens on their pain points. See the three steps.
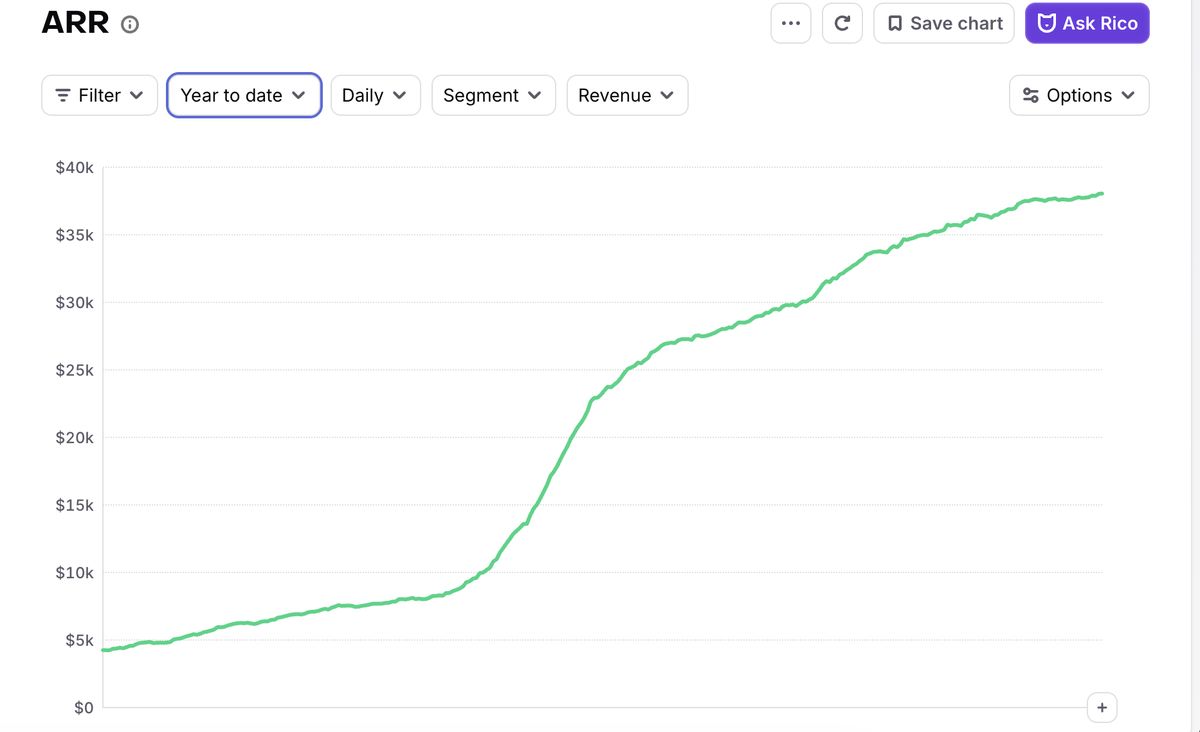
Unedited dashboard screenshot. Year to date, daily, no filters.
Source: Client A's RevenueCat dashboard · ARR · 1 Jan – 24 Oct 2026 · Hover or use arrow keys for exact values
View the data (month-end ARR)+
| Date | ARR (USD) | Phase |
|---|---|---|
| 31 Jan 2026 | $5,500 | Before |
| 27 Feb 2026 | $6,905 | Before |
| 31 Mar 2026 | $8,024 | Before |
| 1 Apr 2026 | $8,036 | Month 0 (we start) |
| 29 Apr 2026 | $11,738 | After |
| 31 May 2026 | $23,738 | After |
| 30 Jun 2026 | $27,595 | After |
| 31 Jul 2026 | $30,667 | After |
| 30 Aug 2026 | $34,881 | After |
| 30 Sep 2026 | $37,476 | After |
| 24 Oct 2026 | $38,024 | After |
Client B · Subscription app · ARR, monthly
ARR up 5.4× in nineteen months
- ARR when we started, Feb 2025
- $34.8k
- ARR in Sep 2026
- $188.8k
- ARR added per month
- $1.3k → $8.1kyear before → since
In plain numbers
Client B's ARR grew from $34.8k in February 2025 to $188.8k in September 2026, 5.4 times in nineteen months. It passed $120k within the first year. In the year before we started it added about $1.3k of ARR a month. Since then it has added about $8.1k a month.
What we did: found new personas, mapped each one to its level of market awareness, and built creative that opens on their pain points. See the three steps.
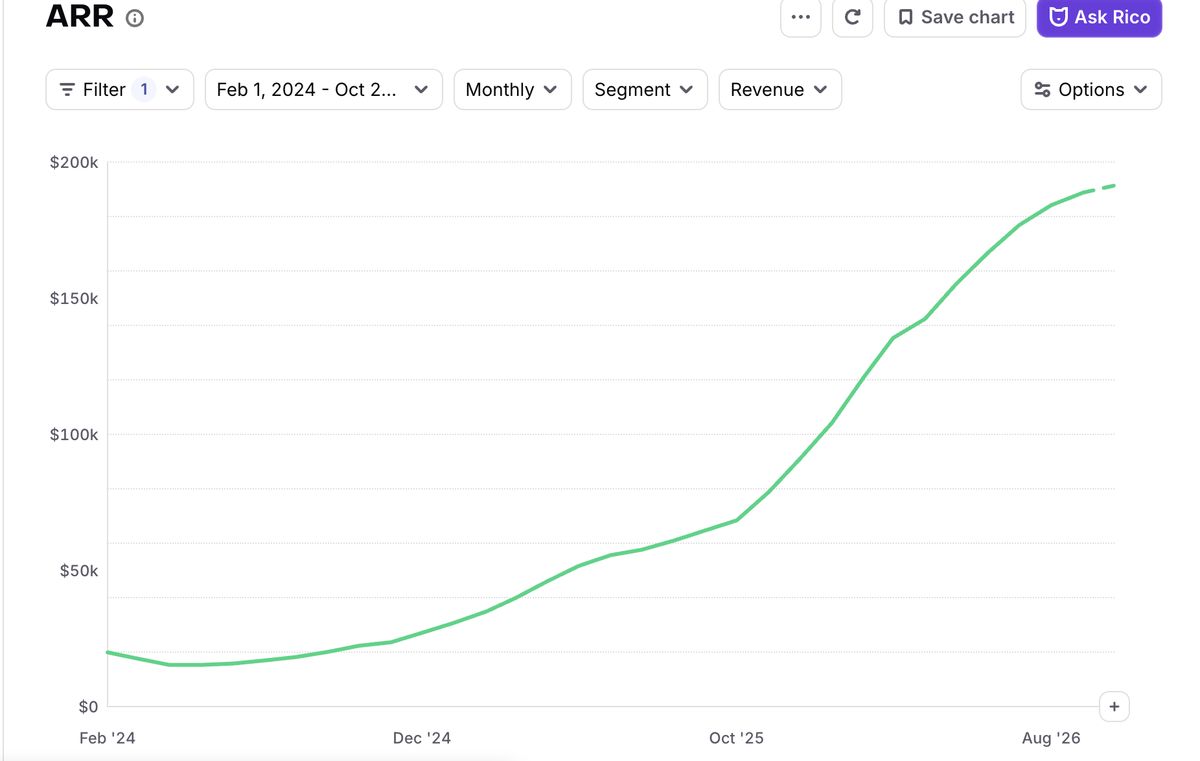
Unedited dashboard screenshot. Monthly, with one dashboard filter applied. October 2026 is RevenueCat's projection and is left out of the redrawn chart.
Source: Client B's RevenueCat dashboard · ARR · Feb 2024 – Sep 2026 · Hover or use arrow keys for exact values
View the data (monthly ARR)+
| Month | ARR (USD) | Phase |
|---|---|---|
| Feb 2024 | $19,762 | Before |
| Mar 2024 | $17,500 | Before |
| Apr 2024 | $15,238 | Before |
| May 2024 | $15,238 | Before |
| Jun 2024 | $15,714 | Before |
| Jul 2024 | $16,905 | Before |
| Aug 2024 | $18,095 | Before |
| Sep 2024 | $20,000 | Before |
| Oct 2024 | $22,381 | Before |
| Nov 2024 | $23,571 | Before |
| Dec 2024 | $27,143 | Before |
| Jan 2025 | $30,714 | Before |
| Feb 2025 | $34,762 | Month 0 (we start) |
| Mar 2025 | $39,881 | After |
| Apr 2025 | $46,071 | After |
| May 2025 | $51,667 | After |
| Jun 2025 | $55,595 | After |
| Jul 2025 | $57,619 | After |
| Aug 2025 | $60,952 | After |
| Sep 2025 | $64,762 | After |
| Oct 2025 | $68,452 | After |
| Nov 2025 | $78,690 | After |
| Dec 2025 | $90,952 | After |
| Jan 2026 | $103,810 | After |
| Feb 2026 | $120,357 | After |
| Mar 2026 | $135,476 | After |
| Apr 2026 | $142,738 | After |
| May 2026 | $155,357 | After |
| Jun 2026 | $166,786 | After |
| Jul 2026 | $177,024 | After |
| Aug 2026 | $184,167 | After |
| Sep 2026 | $188,810 | After |
Client C · Subscription app · Total revenue, monthly
Total monthly revenue up 9.4× in four months
- Revenue when we started, May 2026
- $862
- Revenue in Sep 2026
- $8.1k
- Revenue in Oct 2025
- $0
In plain numbers
Client C's total monthly revenue grew from $862 in May 2026, the month we started, to $8.1k in September 2026, 9.4 times in four months. Revenue had briefly reached $1.9k in April, and against that month the rise is still 4.2 times. In October 2025 the app wasn't making any revenue yet.
What we did: found new personas, mapped each one to its level of market awareness, and built creative that opens on their pain points. See the three steps.
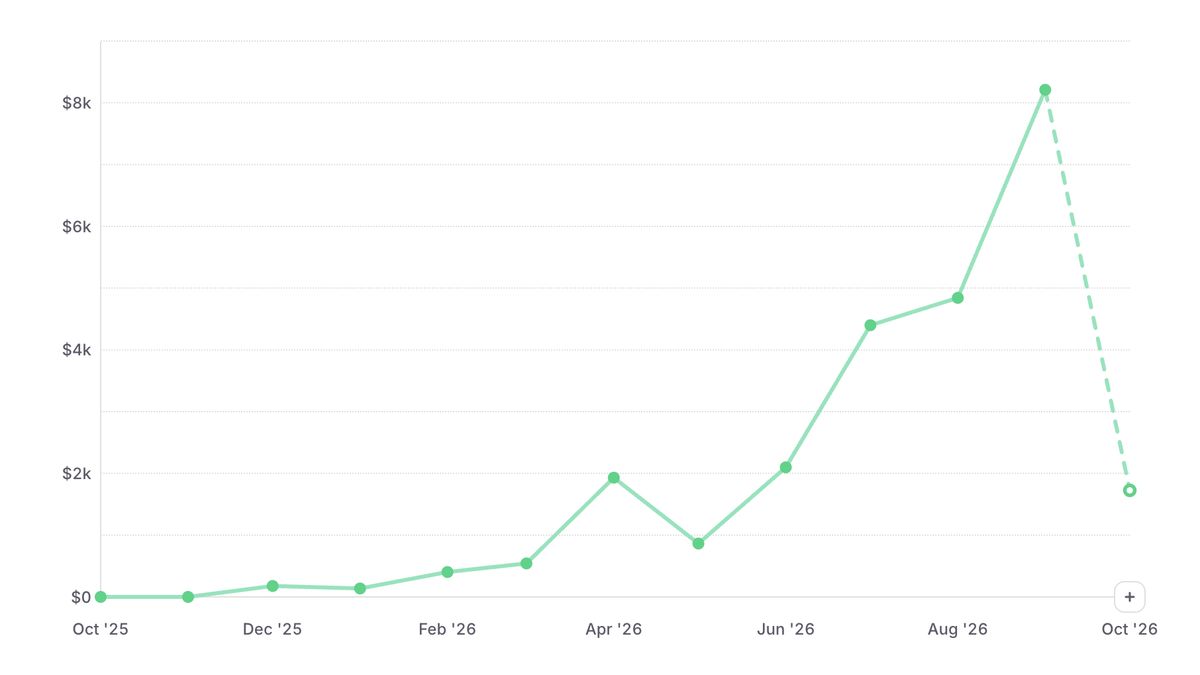
Unedited dashboard screenshot, October 2025 to October 2026. October 2026 is RevenueCat's projection for a month still in progress and is left out of the redrawn chart.
Source: Client C's RevenueCat dashboard · Total monthly revenue · Oct 2025 – Sep 2026 · Hover or use arrow keys for exact values
View the data (total monthly revenue)+
| Month | Total revenue (USD) | Phase |
|---|---|---|
| Oct 2025 | $0 | Before |
| Nov 2025 | $0 | Before |
| Dec 2025 | $177 | Before |
| Jan 2026 | $139 | Before |
| Feb 2026 | $386 | Before |
| Mar 2026 | $541 | Before |
| Apr 2026 | $1,928 | Before |
| May 2026 | $862 | Month 0 (we start) |
| Jun 2026 | $2,099 | After |
| Jul 2026 | $4,396 | After |
| Aug 2026 | $4,835 | After |
| Sep 2026 | $8,139 | After |
Client D · Subscription app · Meta ads, two-month comparison
4× the ad spend, and each trial got 23% cheaper
- Ad spend per two months
- £1,250 → £4,977+298%
- Cost per in-app trial
- £19.53 → £15.13−23%
- In-app trials
- ~64 → ~329spend ÷ cost per trial
In plain numbers
Client D's Meta ad spend rose from £1,250 between 30 April and 30 June 2026 to £4,977 between 1 July and 31 August 2026, almost four times as much. Over the same two months, the cost of each in-app trial fell from £19.53 to £15.13, 23% cheaper, so the account bought about five times as many trials.
What we did: found new personas, mapped each one to its level of market awareness, and built creative that opens on their pain points. See the three steps.
Ad spend
+298%Cost per in-app triallower is better
−23%In-app trialsspend ÷ cost per trial
about 5×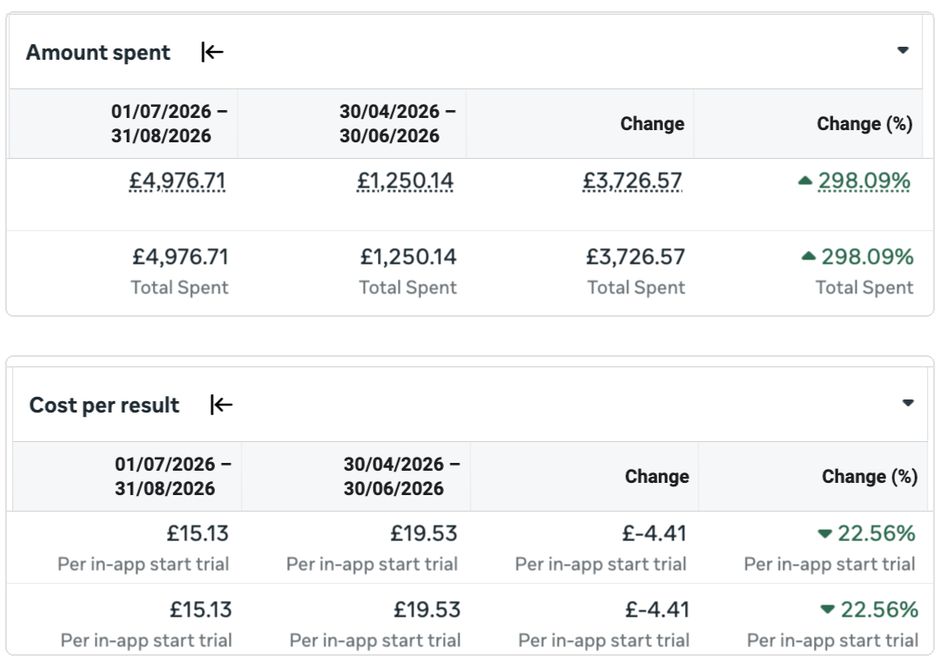
Unedited Ads Manager comparison. Both periods are 62 days long and we ran the account in both.
Source: Client D's Meta Ads Manager · 30 Apr – 30 Jun vs 1 Jul – 31 Aug 2026 · Trials worked out as spend ÷ cost per trial
View the data (Ads Manager)+
| Metric | 30 Apr – 30 Jun 2026 | 1 Jul – 31 Aug 2026 | Change |
|---|---|---|---|
| Amount spent | £1,250.14 | £4,976.71 | +298.09% |
| Cost per in-app start trial | £19.53 | £15.13 | −22.56% |
| In-app trials (spend ÷ cost per trial) | 64 | 329 | +414% |
How we measure
Where the numbers come from
Each client's own RevenueCat or Meta Ads Manager dashboard. Revenue is private, so the apps aren't named, but nothing else is changed. We redraw the line from the unedited screenshot, and that screenshot sits behind every chart.
What month 0 means
The first month we ran the client's Meta ads and creative. Grey shows the months before, so you can compare the pace on each side.
What we leave out
Months still in progress, which RevenueCat shows as a dashed projection. Any dashboard filter is named under the screenshot.
What we don't claim
Pricing, product updates and seasonality move revenue too. These charts show what happened while we ran the ads. They don't claim the ads did all of it.
Want a chart like this for your app?
We take on a small number of subscription apps each quarter and report results from your own revenue dashboard.
Ready to make your creative work harder than your media buyer?
We take on a small number of clients per quarter. Apply below.
Not ready to apply? Book a 30-minute call or try the free creative refresh calculator